

Cashier Variance Report
As an admin you will open the Cashier Variance report to see each cashier's aggregated cash over/short across a date range, with outliers flagged, so you can spot drawer problems and follow up with the right people.
What you'll accomplish
As an Admin you will open the Cashier Variance report to see each cashier's aggregated cash over/short across a date range, with outliers flagged, so you can spot drawer problems and follow up with the right people.
Before you start
The Cashier Variance report lives at /[lang]/reports/session-variance. It is a report-style grid (filter drawer + edge-to-edge sticky table + Excel/PDF export), defaulting to the last 30 days. Each row is one cashier; the columns aggregate the variance recorded when their sessions were closed.
This report is built from closed sessions only — open sessions have no variance yet. Variance is signed: a positive figure means the drawer was over (more cash than expected), a negative figure means it was short.
Compliance Note
Variance is stored and displayed in LAK satang (varianceLAK = counted actual − expected), so the report shows exact satang values; USD and THB variances are tracked per-currency alongside LAK. The outlier threshold is also satang, so flagging stays on raw values.
Steps
Open the Cashier Variance report
Navigate to /[lang]/reports/session-variance. The summary strip shows the number of cashiers, total sessions, and how many are flagged for the selected period.
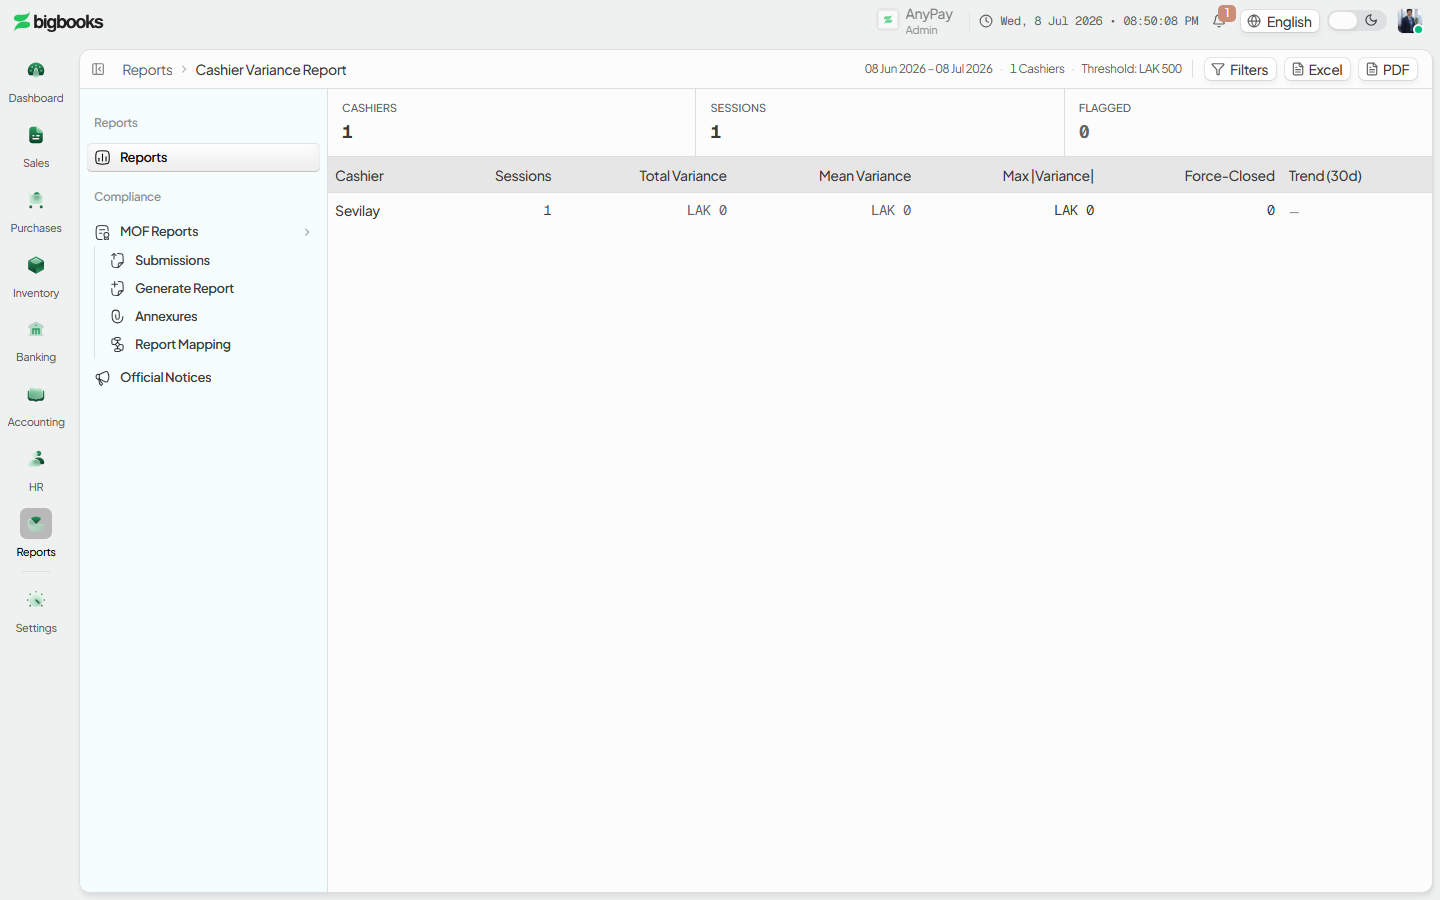
Adjust the date range Open the Filters drawer to change the date range (default: last 30 days), then press Go. The grid refetches the aggregated variance for the new range.
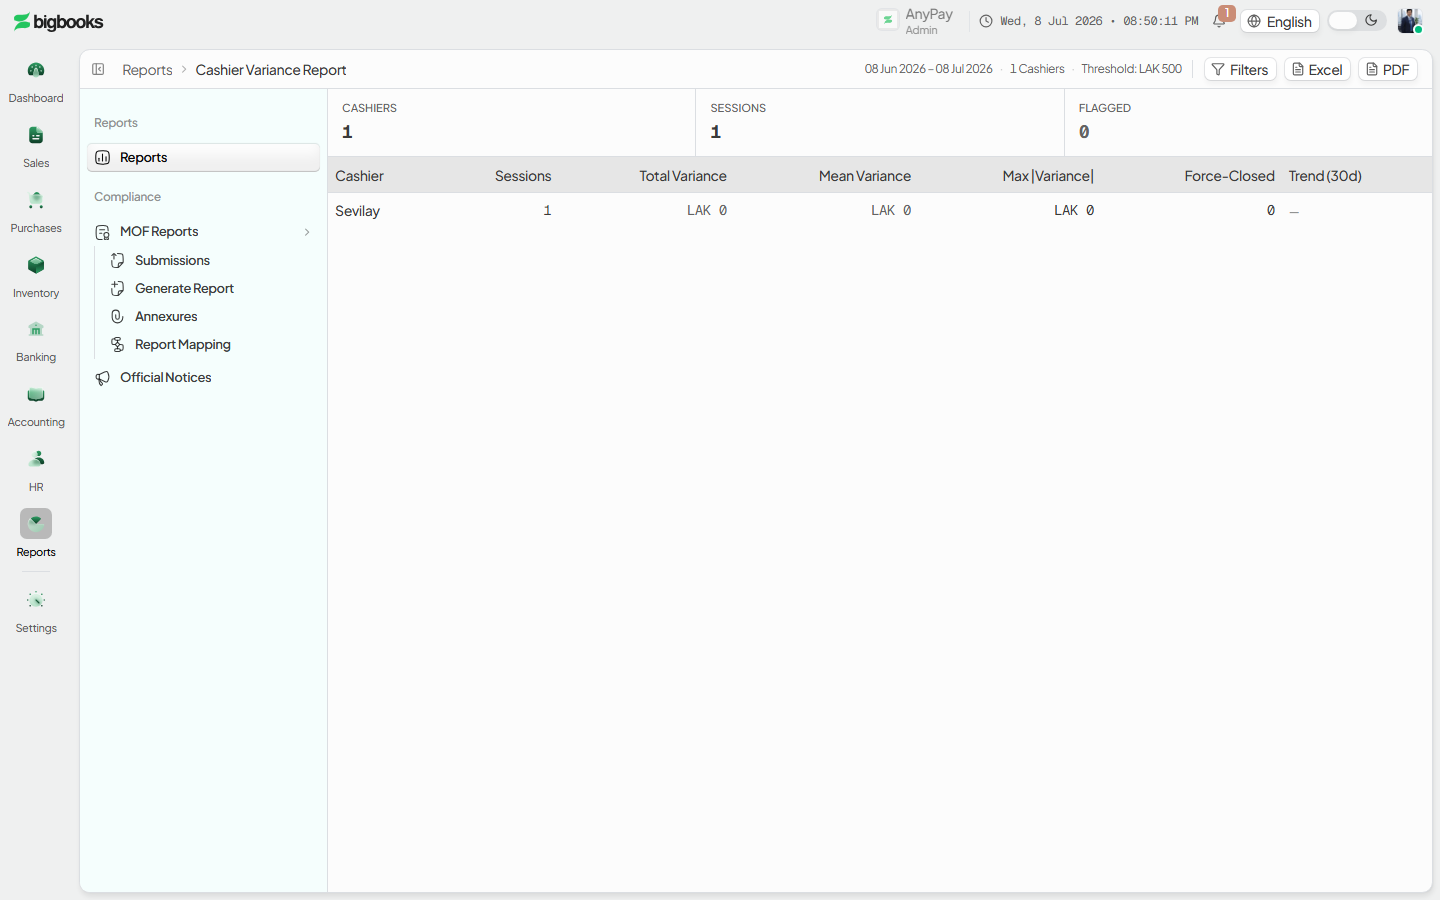
Review flagged cashiers and export Flagged rows are tinted and carry a warning icon; click a cashier to jump to their sessions. Use Excel or PDF to export the same figures for follow-up.
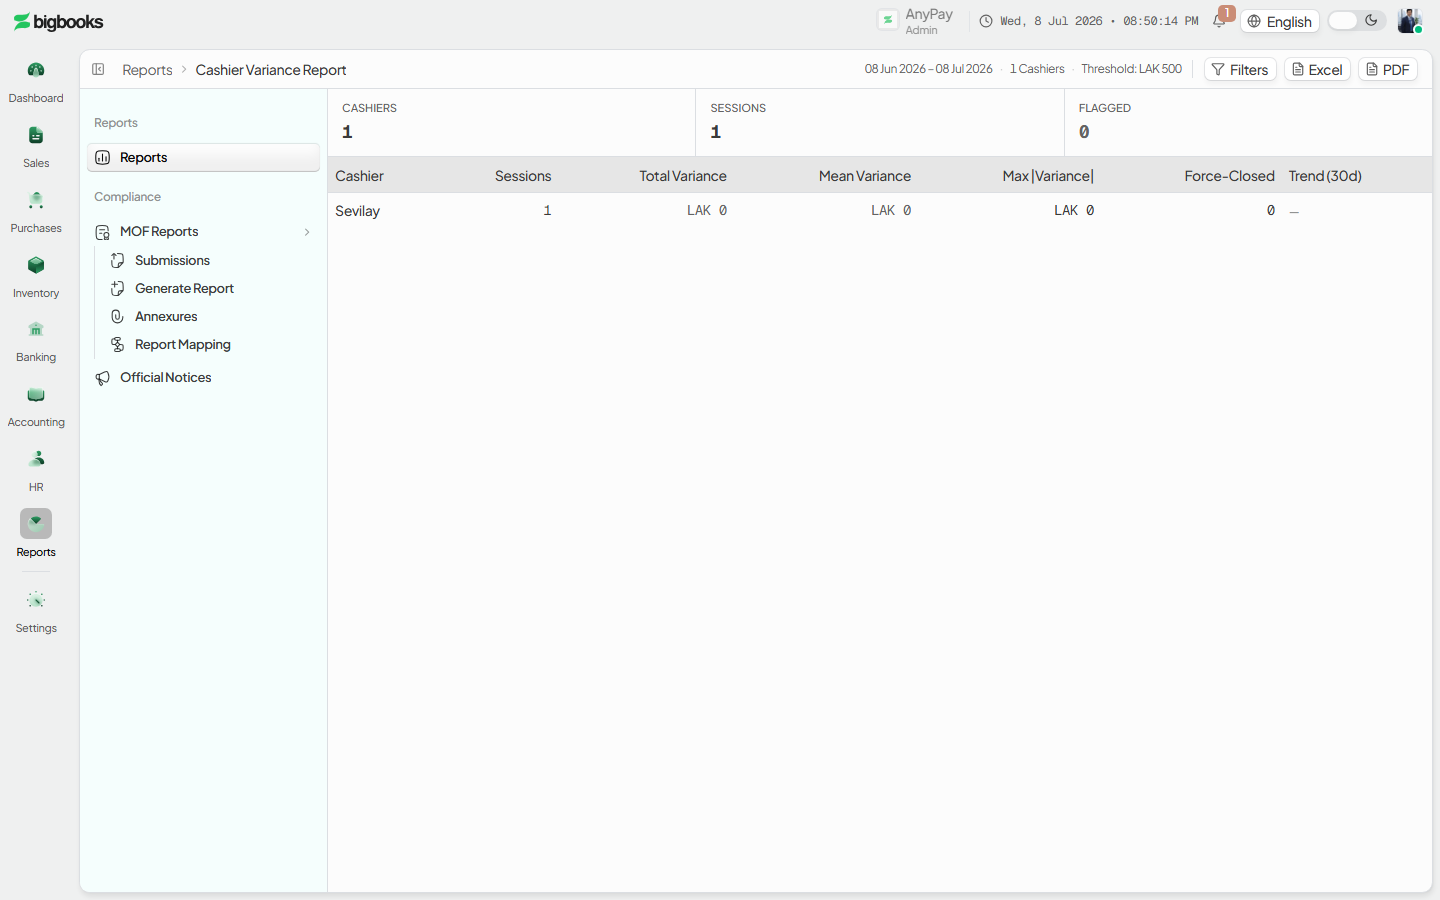
What happens behind the scenes
The grid is fed by counterSessions/queries.ts → varianceByCashier, which collects every non-open session in the date range (via the by_company_date index) and aggregates per cashier: session count, total variance, mean variance (rounded), max absolute variance, force-closed count, and a per-day variance series for the sparkline — for LAK, USD, and THB.
Each session's varianceLAK is the value written at close time by counterSessions/close.ts (counted actual − expected closing). The report does not recompute it; it reads the stored figure, so the report is exactly consistent with what the operator confirmed at session close.
A cashier is flagged as an outlier when any of these hold: the mean variance exceeds the company's varianceThresholdLAK (falling back to a 50,000-satang default), there is at least one force-closed session, or the max absolute variance exceeds twice the threshold. Excel and PDF exports POST the same client-loaded rows to the dedicated /api/reports/session-variance route, so all three outputs match.
Common problems
- Empty report: No closed sessions in the range means an empty grid — widen the date range or confirm sessions were actually closed (open sessions are excluded).
- Invalid date range: A "from" date later than the "to" date shows a validation message and skips the query until corrected.
- A cashier you expected is missing: Cashiers with no closed sessions in the period simply don't appear; check the date range.
- Threshold looks wrong: The flag threshold comes from the company's exchange-rate configuration; if it's unset, the report uses the 50,000-satang default shown in the meta line.
Counter Sessions, Day Book & Cash Book
As an operator you will open and close your counter cash session, and as an admin you will read the Day Book and Cash Book report grids — so the day's takings are recorded as a balanced journal entry and reconciled cleanly against the bank.
Exchange Rates
As an admin, you will keep BigBooks' daily foreign-exchange rates current so that every foreign-currency invoice, bill, and payment converts to LAK at the right buying or selling rate — and so the figure each transaction was booked at never changes after the fact.