

Profit & Loss and Balance Sheet
As an operator or admin, you will produce the two primary financial statements — the Profit & Loss for a period and the Balance Sheet as of a date — and confirm they tie together and to the trial balance.
What you'll accomplish
As an Operator or Admin, you will produce the two primary financial statements — the Profit & Loss for a period and the Balance Sheet as of a date — and confirm they tie together and to the trial balance.
Before you start
Both statements are upgraded report screens at /[lang]/reports/profit-loss and /[lang]/reports/balance-sheet. Each follows the same pattern: a secondary-header breadcrumb, a muted inline summary of the reporting period/date and currency, filters in a bottom Drawer, an edge-to-edge grid with sticky section headers, and an Excel + PDF export pair. Sections and accounts expand inline to reveal the underlying journal entries.
Figures are in integer satang and computed live from posted journal entries — neither statement is stored as a snapshot.
Compliance Note
Net income from the Profit & Loss is what rolls into Retained Earnings on the Balance Sheet. That tie is how Assets = Liabilities + Equity stays true for the same as-of date — verify the two statements with the same date range when you close a period.
Steps
Run the Profit & Loss
Open /[lang]/reports/profit-loss and click Filters. Pick a period preset (This Month / Last Month / This Year / Q1–Q4) or set period start and period end, choose the currency, and optionally enable a comparative period for side-by-side variance. Apply with Go.
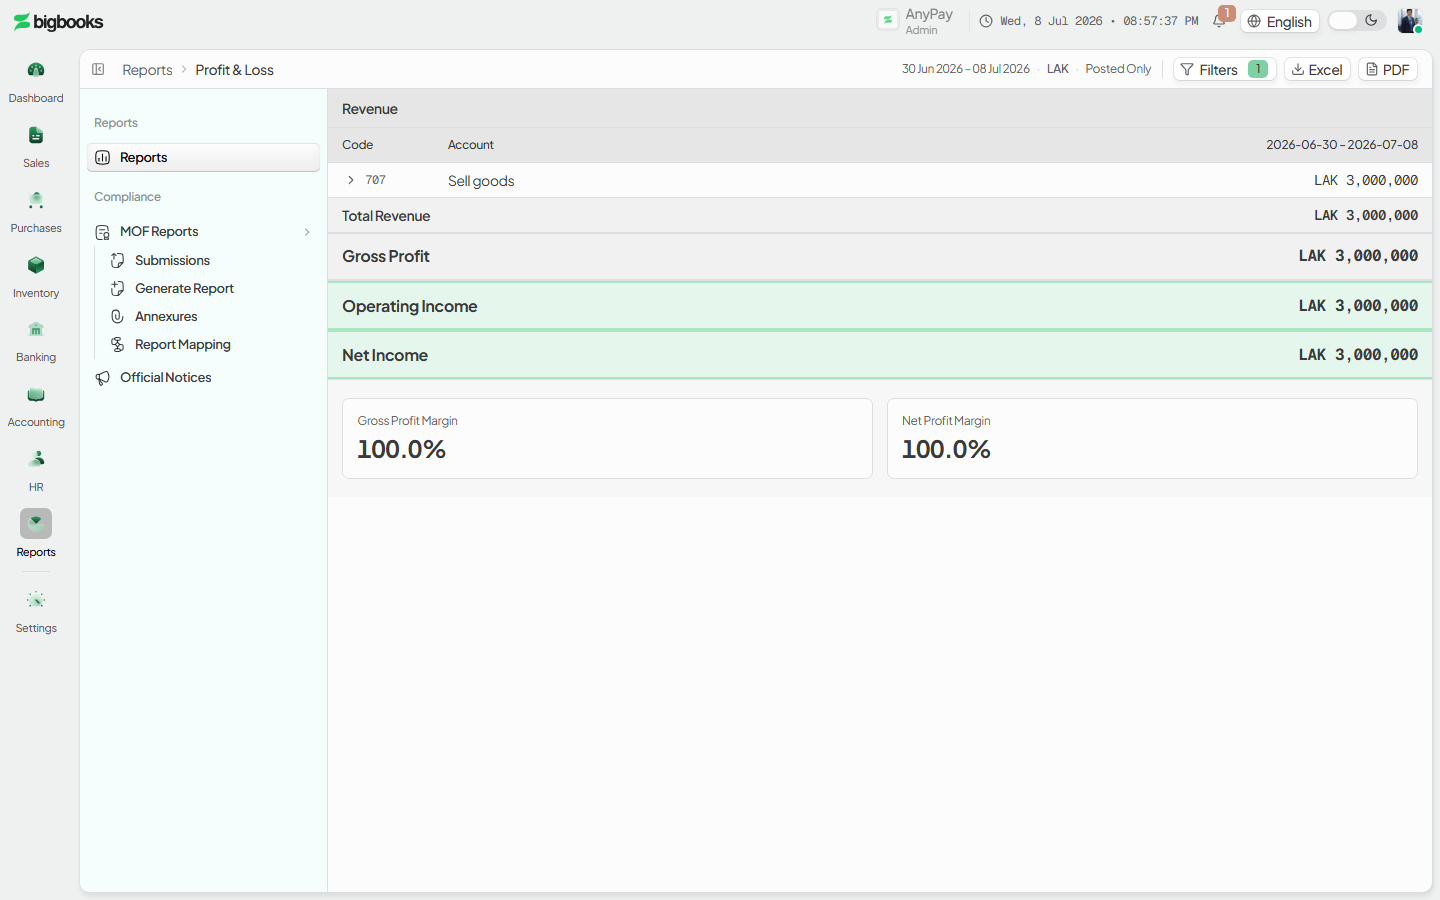
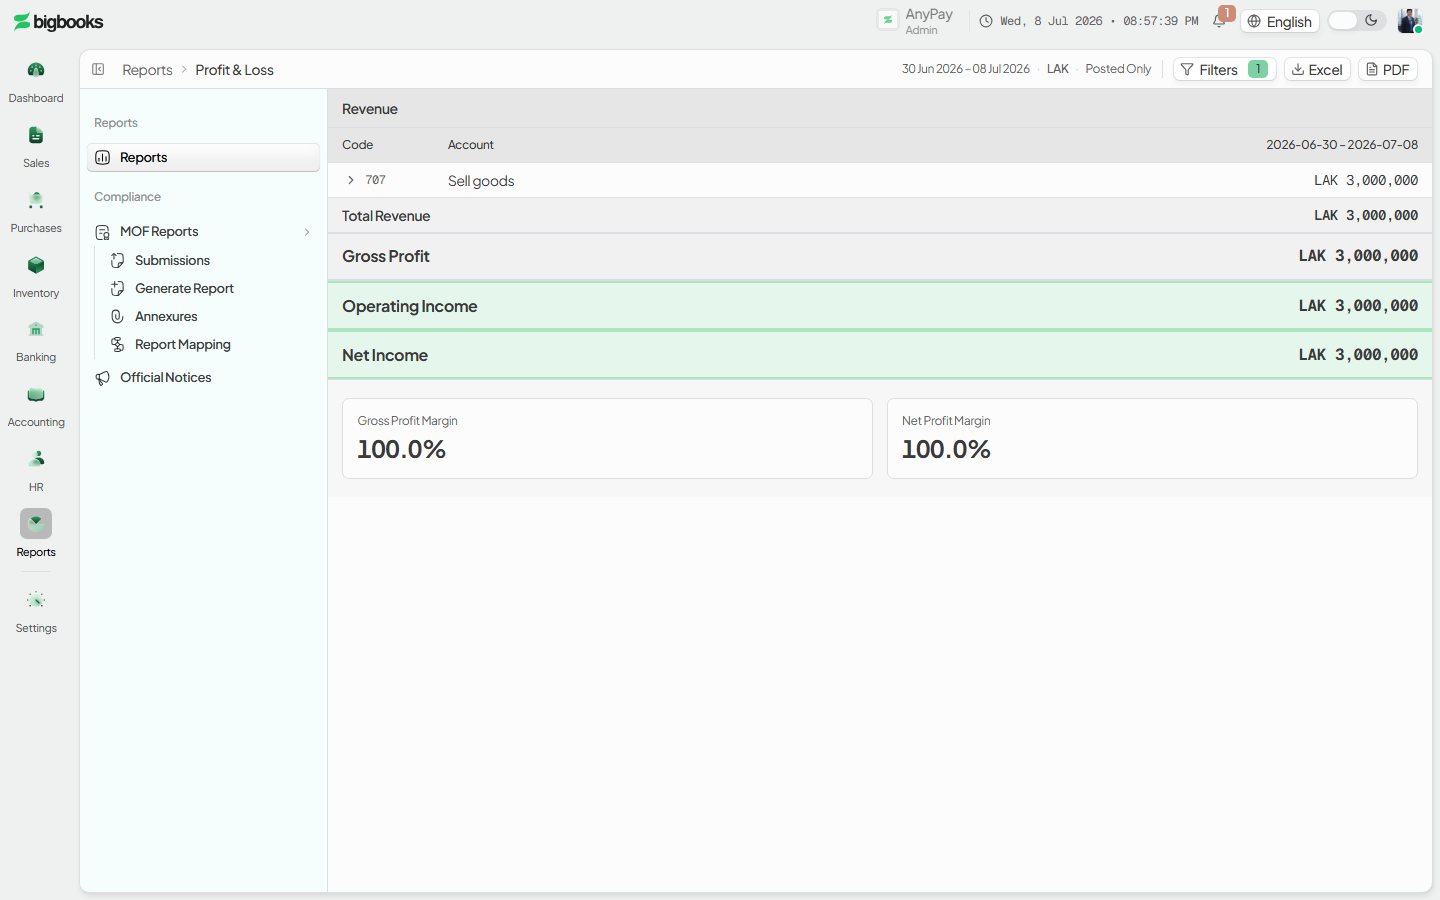
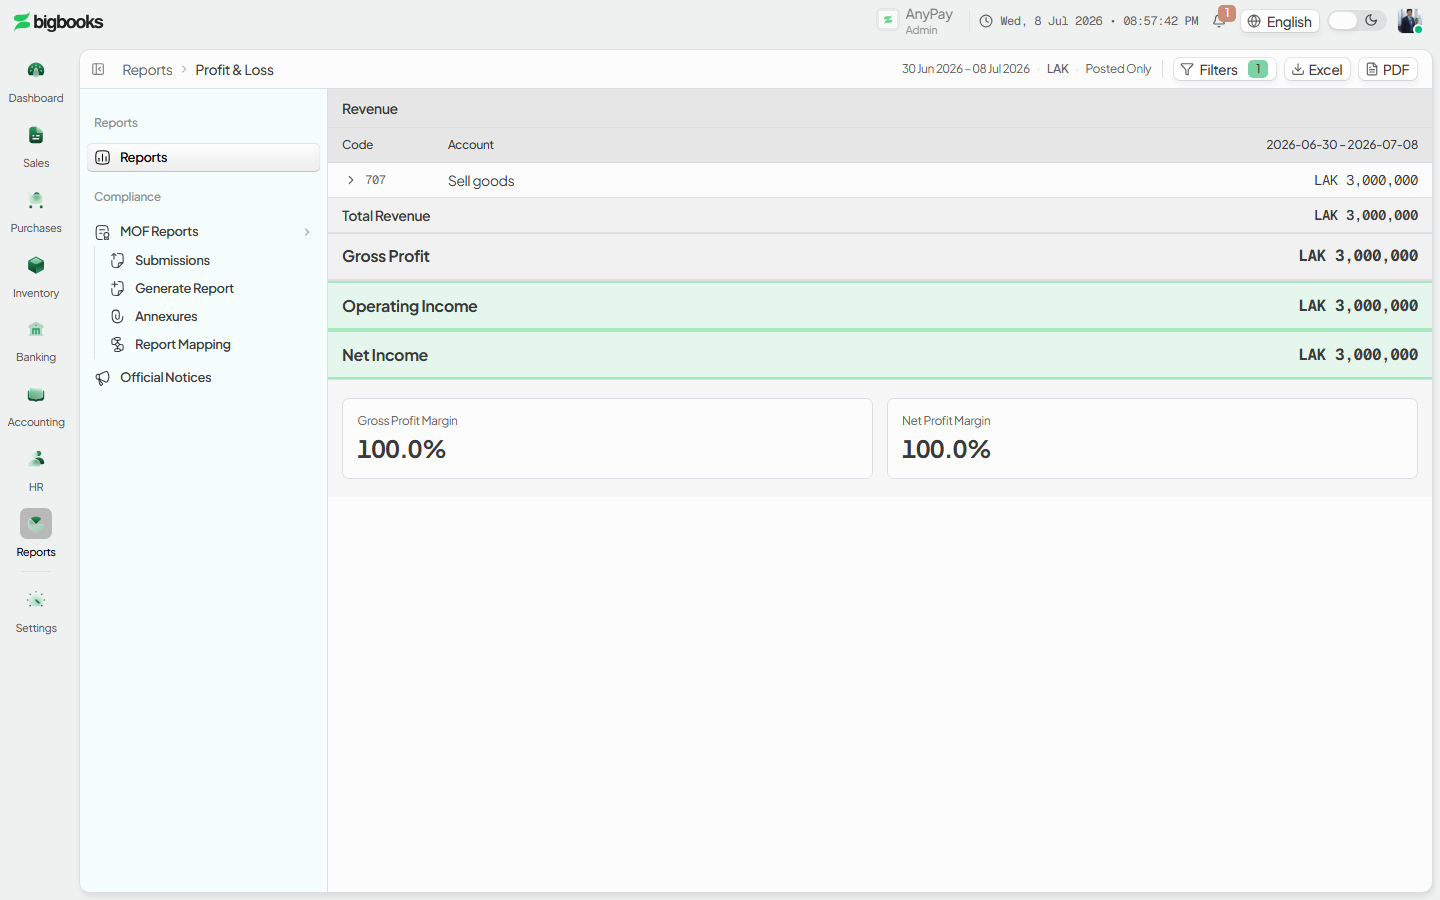
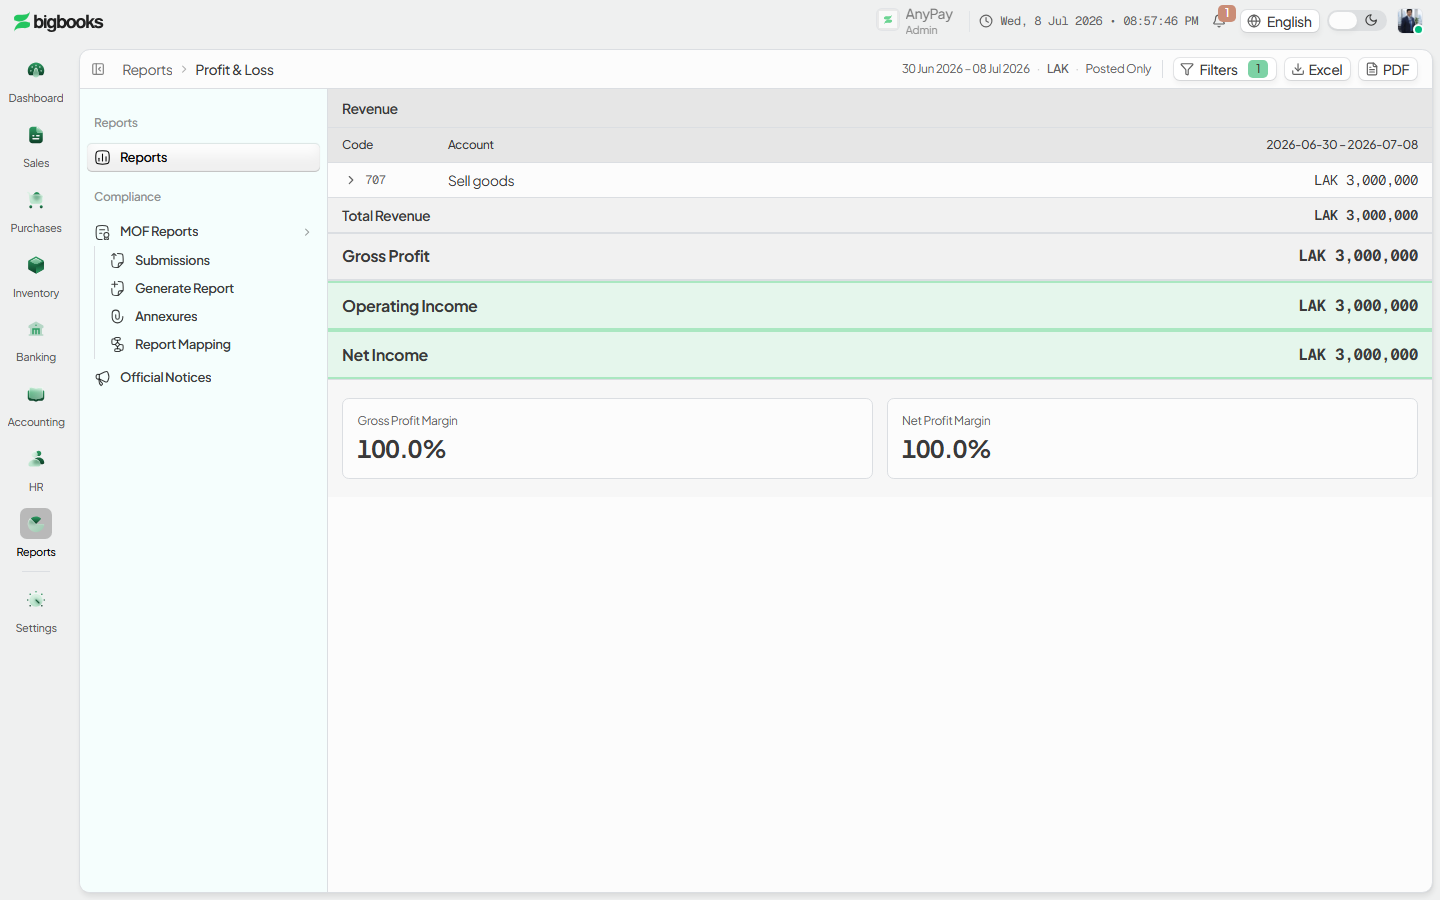
Read the result down to Net Income The statement runs Revenue → Cost of Goods Sold → Gross Profit → Operating Expenses → Operating Income → Other Income/Expense → Net Income, with margin ratios. Expand any line to see its journal entries.
Run the Balance Sheet
Open /[lang]/reports/balance-sheet, set the as-of date (and an optional comparative date), choose the currency or the consolidated all view, and pick the summary or detailed view. The statement groups Assets (Current / Fixed / Other / Inventories), Liabilities, and Equity.
Confirm it balances, then export The Balance Sheet shows a balance-equation check (Assets = Liabilities + Equity) and raises an alert if it does not hold. Export each statement with Excel or PDF from the secondary header; figures match the screen.
What happens behind the scenes
The P&L is produced by generateProfitAndLoss in reports/profitAndLoss.ts; the Balance Sheet by generateBalanceSheet in reports/balanceSheet.ts. Both read posted journal-entry lines in satang and aggregate by account class on demand — nothing is snapshotted.
The P&L sums revenue and expense accounts for the period, derives Gross Profit (revenue − cost of goods sold), Operating Income, and Net Income, and computes a comparative period and variance when requested. The Balance Sheet sums asset, liability, and equity balances as of the date; Retained Earnings is derived from the accumulated P&L net income, which is precisely what makes Assets equal Liabilities + Equity. The Inventories line rolls up the Class-1 inventory accounts (13x) without double-counting. Both use cursor-batched reads to stay under Convex's per-query limit, convert foreign-currency lines to LAK by the period rate when a base currency is selected (the consolidated all view forces LAK), and exclude drafts unless Include drafts is on. Because both come from the same posted ledger as the Trial Balance, all three reconcile for the same date.
Common problems
- Balance Sheet doesn't balance: Almost always an unposted entry or a period boundary mismatch — re-run the P&L and Balance Sheet for the same as-of date and compare Retained Earnings to net income.
- Net Income looks wrong: Check the period start/end and whether Include drafts is on; comparative figures use the comparative period, not the primary one.
- Missing exchange rate: A foreign-currency line without a rate for its date cannot be converted in a base-currency view; add the rate and re-run.
- Statements disagree with the Trial Balance: Confirm all three use the same as-of date and the same drafts setting.
- Export differs from screen: Re-apply the filters so the screen and export share parameters.
MoF Reports
As an operator or admin, you will generate the Ministry of Finance (MoF 2020) statutory report set for an accounting period, take it through approval, and submit it — at which point the figures and the period are locked.
Trial Balance
As an operator or admin, you will produce a trial balance for any as-of date, confirm the ledger is in balance (total debits = total credits), and export it to Excel or PDF.